
Total Blocking Time (TBT) is a lab metric that identifies the time between when the first block of a page appears and when the page becomes reliably interactive. A low TBT guarantees that the page is easily usable. While most Core Web Vitals metrics should ideally be studied using field data, TBT is more important to analyse in a lab environment.
What is TBT?
As a quick reminder, FCP is a metric indicating the moment when the first text or image is displayed. TTI, or Time to Interactive, corresponds to the time needed for the page to become fully interactive.
The Total Blocking Time (TBT) metric measures the total time between First Contentful Paint (FCP) and Time to Interactive (TTI). Explained more technically, TBT is a sum in milliseconds of all periods between First Contentful Paint and Time to Interactive where the duration of a task exceeds 50 ms.
The main thread is considered “blocked” whenever there is a long task. A long task runs for more than 50 ms.
To illustrate, take this timeline as an example — there are 5 tasks, 3 of which exceed 50 ms.
Here is how your TBT score is built:
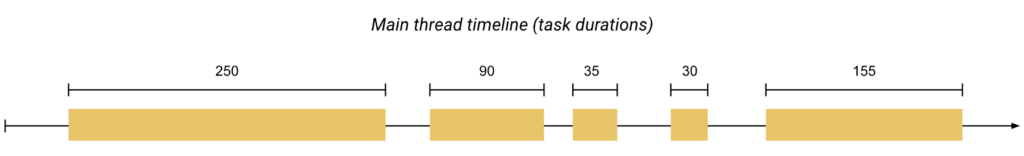
So while the total time spent executing tasks on the main thread is 560 ms, only 345 ms of that time will be counted as blocking time.
Note: TBT is the most important criterion in Core Web Vitals (30% of the score).
How to measure TBT?
TBT is a metric that needs to be measured in a lab environment. The best way to measure TBT is to run a Lighthouse performance audit on your site. I recommend these 2 tools to analyse your TBT in the “lab”:
- Chrome Dev Tools // Lighthouse
- webpagetest.org
Google recommends that this metric be analysed in a lab environment rather than in the field, since user interaction could affect the TBT of your page in a way that causes many variations in your reports.
Note: A good TBT score is 200 ms or less.
Improving your TBT (Total Blocking Time) score
To find out how to improve TBT, you can run a Lighthouse performance audit and use the opportunities it suggests. Let’s walk through the four main categories and how to improve each one.
- Reduce the impact of third-party code
- Reduce JavaScript execution time
- Minimise main-thread work / Avoid an excessive DOM size
- Avoid long tasks on the main thread
1. Reduce the impact of third-party code
Third-party code is simply any script hosted on a domain different from the URL you audited with Lighthouse. As the page loads, Lighthouse calculates how long each third-party script blocks the main thread. If the total blocking time exceeds 250 ms, the audit fails.
Common culprits include third-party scripts like Google Analytics, fonts that are not self-hosted, A/B testing scripts, etc.
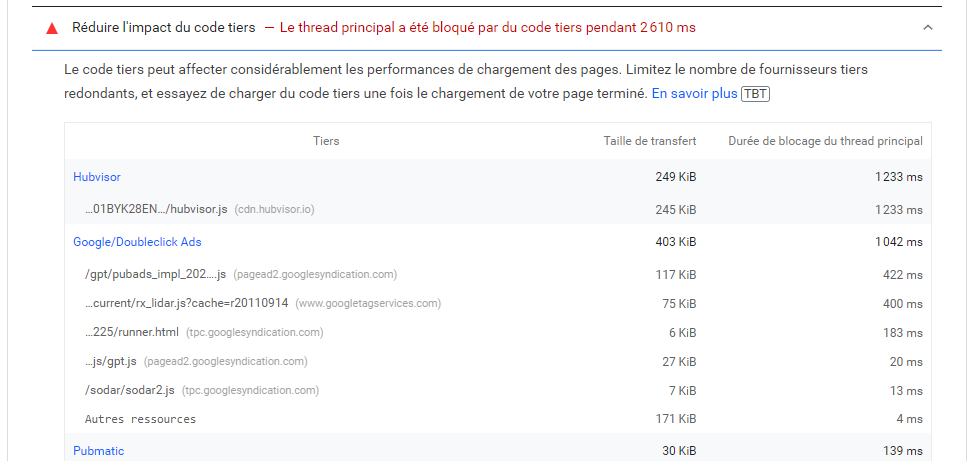
Using Lighthouse, you can quickly evaluate which third-party scripts your site uses and how resource-intensive they are:
If a third-party script is slowing down your page load, you have only two options to improve performance, since you have no control over the script itself:
- Remove it if it adds little or no value to your site
- Optimise the loading process so that it does not block the thread
Here are 4 techniques we will cover to reduce the impact of third-party code:
- Using the async or defer attribute on script tags
- Establishing early connections to required origins
- Lazy loading
- Optimising how you serve third-party scripts
1.1 Use async or defer
Since synchronous scripts delay DOM construction and rendering, you should always load third-party scripts asynchronously, unless the script must execute before the page can be rendered.
The async and defer attributes tell the browser that it can continue parsing HTML while the script loads in the background, then execute the script after it has loaded. This way, script downloads do not block DOM construction and page rendering. The result is that the user can see the page before all scripts have finished loading.
Here is what that looks like in code:
<script async=”” src=”script.js”>
<script defer src=”script.js”>
The difference between async and defer is the moment at which they start executing the script.
Simply explained, async scripts may not be executed in the order in which they appear in the HTML code. This also means they can interrupt DOM construction if they finish downloading while the HTML is still being parsed.
→ Use async if it is important that the script executes earlier in the loading process.
Defer executes after the HTML is fully parsed and complete. It guarantees that scripts will be executed in the order they appear in the HTML and will not block the parser.
→ Use defer for less critical third-party scripts, such as a third-party advertising script.
Note: If you want to progress quickly, Google has set up an interactive “course” to optimise third-party JavaScript: https://web.dev/codelab-optimize-third-party-javascript/
1.2 Pre-connect to critical third-party resources
If a third-party script is considered important (critical) for the proper functioning of your site and its layout, rather than improving the score by deferring the script, it is also possible to pre-connect to the domain name. This way, you can save between 50 ms and 500 ms. However, it is not recommended to use this technique on all your third-party scripts, as it could delay other important resources.
To do this, you can use the following code:
<link rel=”preconnect” href=”https://example.com”>
The “preconnect” attribute is only for the most critical connections; for less critical third-party domains, it is preferable to use dns-prefetch.
However, it is possible that not all browsers support the “preconnect” attribute, which is why preloading with “preconnect” should also be specified with “dns-prefetch” as a fallback.
Here is an example:
<link rel=”preconnect” href=”https://example.com”>
<link rel=”dns-prefetch” href=”https://example.com”>
1.3 Improve third-party code loading with lazy loading
If third-party code is not critical or is “below the fold” (meaning users have to scroll to see it), lazy loading is a good way to improve TBT as well as LCP & FCP metrics. This way, your users get the important content of the page first.
Also known as deferred loading, this technique consists of loading third-party content only when users scroll to the relevant section.
Once again, ads significantly slow down a page’s loading speed. By loading them only when users reach the section where they are displayed, you prioritise all the important resources for your site. According to Google, MediaVine switched to deferred loading for ads and saw a 200% improvement in page loading speed.
Intersection Observer is a browser API that efficiently detects when an element enters or exits the browser viewport and can be used to implement this technique.
Lazysizes is a popular JavaScript library for lazy loading images and iframes like YouTube widgets. It also has optional support for IntersectionObserver.
If you use WordPress, the simplest solution is to install a plugin that does this for you, such as WP Rocket. I invite you to look into lazy loading depending on your technology.
1.4. Optimise the speed of third-party scripts
There are two methods to optimise the speed of third-party code: using a CDN or self-hosting your scripts. Generally, tools that provide third-party code use URLs with a built-in CDN. So if you want to optimise script speed, the best approach is to self-host your scripts. If you use a relatively high-quality hosting service, it is very likely that your servers will be faster and that you will have full control over the cache. This also avoids unnecessary lookups such as DNS resolution, the time the browser takes to establish a new HTTP connection, and SSL negotiation with the other server.
It is nonetheless important to know that when self-hosting third-party code, the code may not function correctly, and in any case you will need to set up regular maintenance since automatic updates will not be applied on your side.
2. Reduce JavaScript execution time
Honestly, there are not many additional optimisations available to reduce this metric beyond what we have already covered. It is likely that in this part of the audit there will also be third-party code, so you can use the techniques we have already seen, such as self-hosting to reduce execution time, or lazy loading regardless of whether the code is third-party or not.
Otherwise, it is possible to apply these additional recommendations:
- Minify and compress your code.
- Remove unused code.
- Improve speed with the PRPL pattern (Push / Render / Pre-cache / Lazy load). This involves using “preload”, “async”, a cache, and “lazy load”.
Feel free to complement your reading with our article on improving the LCP score, where we have already covered these 6 points in detail.
3. Reduce main-thread work & Avoid an excessive DOM size
The browser rendering process is what transforms your code into a web page that users can interact with. By default, the main thread of the rendering process generally handles most of the code: it parses the HTML and builds the DOM, parses the CSS and applies the specified styles, and parses, evaluates and executes JavaScript.
The main thread also handles user events. So whenever the main thread is busy doing something else, your web page may not respond to user interactions (TBT), resulting in a poor experience.
3.1 Optimise CSS for thread calculation
The complexity of style calculations can significantly increase main-thread work. According to Rune Lillesveen (Opera browser): “About 50% of the time used to calculate the computed style of an element is used to match selectors, and the other half of the time is used to construct the RenderStyle (representation of the computed style) from the matched rules.”
Therefore, it is preferable to reduce the complexity of your selectors. For example, this code is good:
.title {
/* styles */
}
On the other hand, this type of CSS selector is considered bad practice in terms of performance:
.box:nth-last-child(-n+1) .title {
/* styles */
}
Indeed, in order to know that styles should apply, the browser must ask “is this an element with a title class that has a parent which happens to be the minus nth child plus 1 element with a class?”
This can take a significant amount of time, depending on the selector used and the browser in question. To know, for example, that the element is the last of its type, the browser must first know everything about all other elements and whether there are elements coming after it that would be the nth-last-child, which is potentially much more costly than simply matching the selector to the element because its class matches.
3.1.2 Reduce the number of elements to style
Another factor to consider is style changes — avoid adding unnecessary CSS if the element was already correctly defined; otherwise, add a new CSS selector.
.box {
width: 20px;
height: 20px;
}
/**
* Changing width and height
* triggers layout.
*/
.box–expanded {
width: 200px;
height: 350px;
}
And simply avoid a large number of CSS selectors that may be unnecessary. For example, a good practice would be to apply as much styling as possible to the body tag and not create a CSS selector for every text element, as a WordPress visual builder would do 😉
If it is not possible to avoid layout, the key is to use Chrome DevTools to see how long it takes, then identify the problematic elements to prioritise impact. To do this, open DevTools, go to the Timeline tab, click Record and interact with your site. When you stop recording, you will see a breakdown of your site’s performance.
Unfortunately, even though this is a comprehensive guide focused solely on TBT, it would be too long to list every possible optimisation. I wanted to make that clear. I have tried as much as possible to suggest optimisations that can have the most impact and that are the least complex.
3.1.3 Additional optimisations for CSS
Here are some additional ideas to reduce main-thread work by optimising CSS:
- Extract critical CSS
- Minify CSS
- Defer non-critical CSS
- Remove unused CSS.
Since these 4 points also influence LCP, they have already been covered in detail. I strongly invite you to consult the relevant article that guides you step by step through this process. At the same time, LCP (Largest Contentful Paint) is linked to FCP (First Contentful Paint) and TBT is a blocking measurement between FCP and TTI.
3.2. Optimise JavaScript
The previous optimisations also apply to optimising your JavaScript — minify, defer, remove unused code, etc. It is also worth noting that other optimisations covered in our LCP article could also impact your TBT, such as reducing JavaScript payloads.
4. Avoid long tasks on the main thread
Yes, the end is almost here! I hope you are not too disappointed — and if you are still reading, congratulations. I am going to repeat myself and I apologise for it, but I strongly invite you to complement your reading with our comprehensive guide on LCP, which is the second most important Core Web Vitals factor (25% of the score) and guides you through the optimisations just below.
But I will still highlight the important points for limiting long tasks, which simply come down to reducing the number of resources and their sizes:
- Optimise your JS / CSS
- Optimise your images / iframes / videos and avoid using .gif
- Optimise your fonts
- Invest in good hosting
If you have any questions, suggestions or anything else, feel free to ping me on Twitter or leave a comment! If you enjoyed this article, feel free to share it. But above all, thank you for reading.