Time to Interactive (TTI) is one of the six metrics that influence the Core Web Vitals score (out of 100), as reported by Google PageSpeed Insights. Each metric captures a different aspect of page load speed, and above all a specific user experience standard defined by Google. TTI defines the time required for a user to be able to interact with a page.
What Is Time to Interactive (TTI)?
TTI measures the time it takes for a page to become fully interactive. A page is considered fully interactive when:
- The page displays “useful” content, measured by the First Contentful Paint (FCP).
- Event handlers are registered for the most visible page elements.
- The page responds to user interactions within 50 milliseconds.
As mentioned, TTI accounts for 10% of the score. A good score (green) falls between 0s and 3.8s; average (orange) between 3.9s and 7.3s; poor (red) is a TTI above 7.3s.
How to Improve Your TTI Score?
One improvement that can have a particularly significant impact on TTI is deferring or removing unnecessary JavaScript. To find and analyze unused code snippets or scripts, simply use Chrome DevTools.
You can also consider reducing JavaScript payloads using the PRPL pattern:
- Preload critical resources
- Async / defer non-critical scripts
- Cache assets efficiently
- Lazy load below-the-fold resources
Optimizing third-party JavaScript can also bring significant improvements, especially for sites that use a lot of it. Third-party scripts are simply JavaScript that does not originate from your domain but is executed on your site — such as a Google Analytics script.
These two “classic” audits offer additional opportunities to reduce JavaScript workload:
- Minimize main-thread work
- Reduce JavaScript execution time
Feel free to follow the links in those articles for detailed A-to-Z processes, as well as the PRPL pattern for applying it to your site.
It is also possible that a poor TTI score is caused by a low Time to First Byte (TTFB) — the time your server takes to respond. In that case, invest in better hosting and a CDN.
The TTI Score: Don’t Focus Too Much on This Metric
Unless you have a specific reason to focus on this metric, it is generally better to focus on improving your overall performance score — particularly LCP (Largest Contentful Paint) and TBT (Total Blocking Time). By improving those two metrics, you will naturally improve your Time to Interactive (TTI) as well, since the optimizations are the same.
I recommend going back to Lighthouse or webpagetest.org once you have finished optimizing those 2 metrics (which together account for 55/100 of the score), and then refining your TTI if it still needs improvement. At that point, check the items I raised earlier to see whether they are actually in place and whether they appear in a Lighthouse audit.
Finally, improve those specifics while drawing on my guides for LCP & TBT to learn how to proceed.
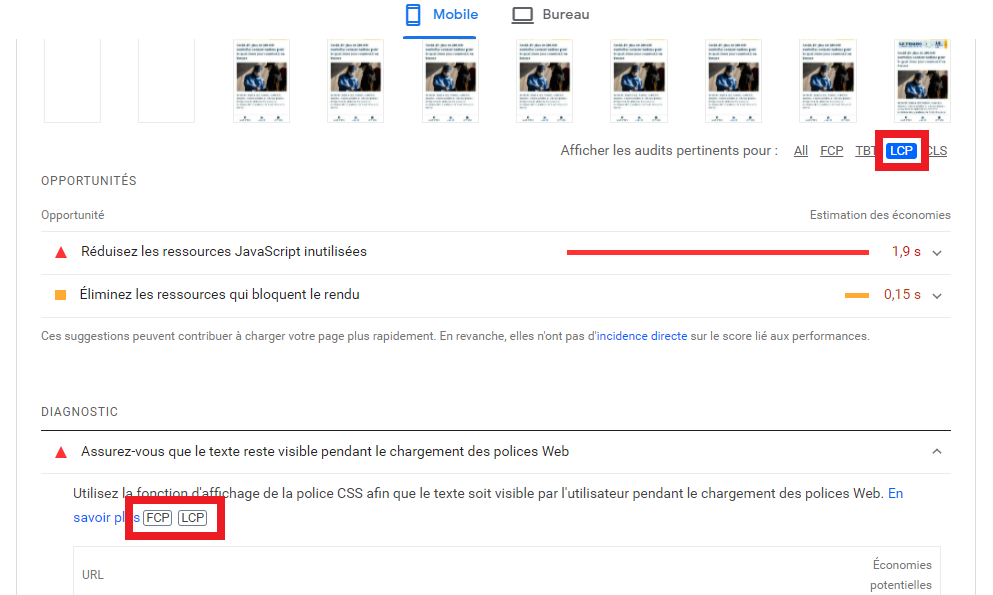
Note that Lighthouse does not show you what specifically impacts TTI — it only displays FCP, TBT, LCP and CLS — that is 4 out of 6 metrics, and some of the “major metrics” share the same optimizations.
As illustrated in this Google PageSpeed screenshot: