
Improving the speed of a website is a step that must not be overlooked, for three essential reasons.
- Site speed improves user experience and thus allows a very significant increase in the conversion rate
- Speed also allows improving the user experience on site management (back office).
- Site speed and Core Web Vitals allow improving the SEO of a website.
In this condensed article you will discover the best tools for obtaining the best results. I would like to clarify that the tools are rather technically oriented, so I have not included tools like Google Page Speed which often misleads more than it helps.
Difference Between Speed and Core Web Vitals
I regularly notice that internet users make no distinction between Core Web Vitals and site speed. No, they are not the same thing and it is important not to confuse them. Core Web Vitals are specific user experience criteria created by Google. As a result, a site’s speed can be extremely fast without complying with the rules that Google has “imposed”.
Since this article deals with site speed, I recommend consulting our article to improve your Core Web Vitals if that is what interests you.
It is nonetheless highly likely that by improving the speed of your pages, you may notice a higher score on Google Page Speed Insights.
The 5 Best Tools to Test Website Speed
What loading time should you see with these tools? The faster, the better obviously, but most suggest that a loading time of less than 2 seconds is often sufficient.
If you want to improve the speed of your site, it is important to know how to do it properly. For this, I recommend:
- Carrying out several tests and then calculating an average
- Choosing a consistent test location (if your users are French, do not do a speed test in Tokyo)
- Keeping in mind that there is a difference between perceived performance and actual performance.
For example, the Google Search Console gives you CWV scores recorded directly in the field (real data), which is not the case with GPSI.
Indeed, Google Page Speed likely uses servers far from your real customers. Moreover, your customers very probably have 4G or even 5G. Google uses slow networks (slow 3G). You are certainly far from the mark therefore.
For example, a restaurant in Paris with a booking website will only have Parisian users, who are probably mostly on 5G and/or very powerful fibre connection. Thus, GPSI could indicate a very different score from the Google Search Console.
It is now time to dive into the tools for analysing your site’s speed!
1. WebPageTest.org
If you are looking for a tool to calculate and moreover optimise your site’s speed, this tool is really ideal. What is even more interesting is that not only will it give you a wealth of information to improve speed and CWVs, but it also allows you to configure a whole range of things for the simulation — all completely free and in just a few seconds.
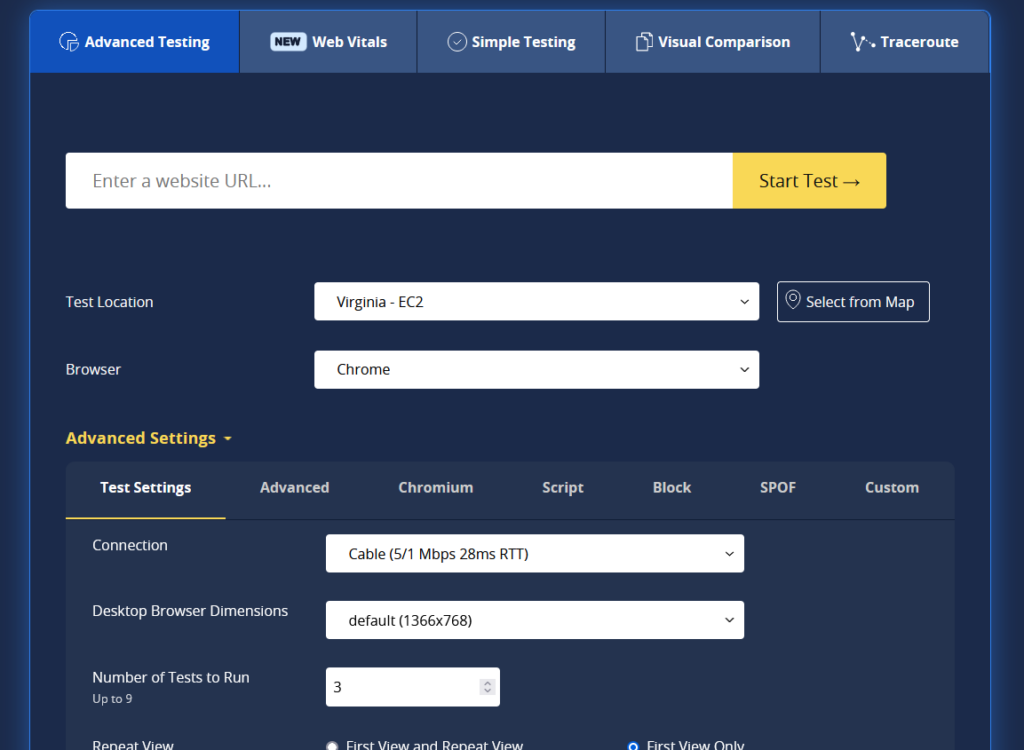
It is possible to perform speed tests from the Paris location, to use a specific browser, a specific smartphone, to choose the connection speed (ideal if you know the average connection of your users), and many other things. On the CWV side, it has nothing to envy from GPSI — quite the contrary — and it will automatically take screenshots so you can analyse the CLS in real time (layout shift, or cumulative layout shift) and will explain step by step why it gave you the score. It is the most indispensable tool. While some data will certainly be too technical and therefore not easily exploitable for web development novices, it still caters to all types of profiles.
My personal favourite is that it allows you to quickly see why a site is slow. Its beautiful pie charts quickly highlight whether a site’s slowness is due to images, excessively large CSS files, or JavaScript…
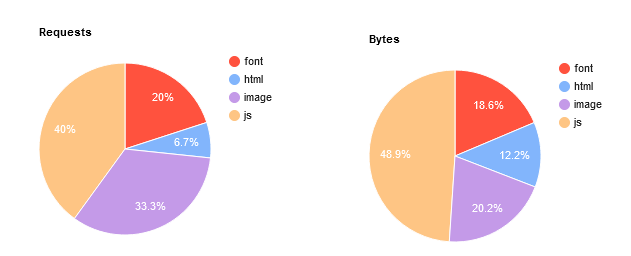
Note: In this type of case, for example, if your site is too slow, by using system font stacks rather than Google fonts or custom fonts, it is possible to gain about 20% in loading speed in less than a minute.
2. Chrome Dev Tools
Chrome Dev Tools is for me the only tool measuring the speed and CWVs of Google that is actually interesting to use. It is a very popular tool among developers because it is easily accessible and powerful. Simply right-click then click on “Inspect” to access all the features (included natively in the Chrome browser). By going to the Performance tab, you will need to click the small refresh icon or use the Ctrl + Shift + E shortcut to generate a detailed analysis of your website.

You will thus have access to a detailed waterfall analysis, screenshots to observe your site’s CLS, LCP, and many other things. You will also have the overall loading speed as well as the loading time details for each frame. It is also possible to click on the Lighthouse tab to launch a GPSI analysis (GPSI uses Lighthouse).
Note: Chrome offers the ability to block requests in order to determine each partial of your site and see which script is generating a performance problem. It is also possible to disable cache, limit the connection, and many other things.
3. New Relic
Available for free, this tool is nonetheless geared towards making purchases. But if you need more data than that provided by the previously mentioned tools, it will complement your analyses perfectly. New Relic is a monitoring tool — it is inadvisable to leave it on constant surveillance as it could slow down your site’s speed. If the previous tools were intimidating, know that this one is more dedicated to developers and Ops. However, since there are far too many features to mention, it would be of very little use to list them all. What is important to remember is that this tool will fully satisfy you. To give you an example nonetheless, I greatly appreciate this tool for analysing which plugins consume the most on a WordPress site:
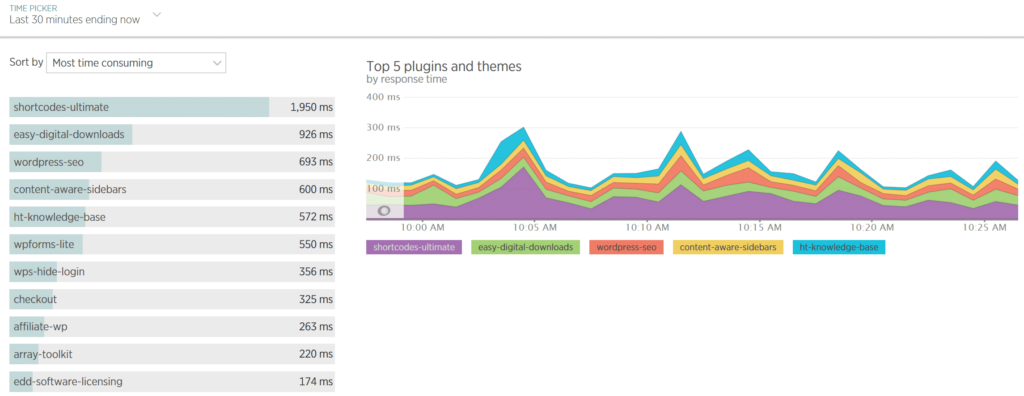
(New Relic is free if you use Kinsta hosting)
4. Kinsta APM
Kinsta is a hosting service dedicated to websites using WordPress. Their internal tool Kinsta APM is available for all plans and is therefore exclusively for WordPress sites. Like New Relic, Kinsta APM is a monitoring tool — while it is admittedly less comprehensive than New Relic, it was created to monitor WordPress sites specifically. It will therefore give you the information you are most interested in without too many unnecessary headaches.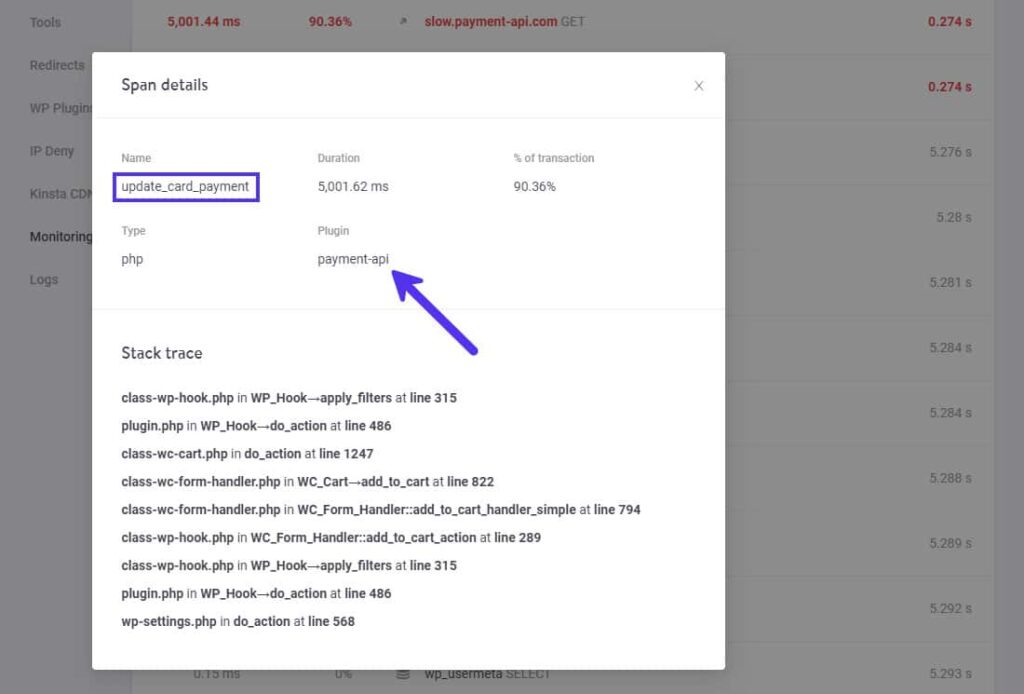
The “Trace stack” section helps you identify all the processes involved in poorly optimised scripts. Kinsta has also published numerous case studies for optimising a WooCommerce site and others using this tool — articles I recommend reading if you are interested (easy to read).
5. Pingdom Website Speed Test
Pingdom is a very good tool for analysing the real loading time of a website. It is possible to choose several locations in order to analyse the actual speed performance as precisely as possible. It is a very quick and easy-to-use indicator — ideal for calming the nerves after this article presenting the best (but complex) tools.

Since Pingdom does not have a test centre for France, choose the closest location according to your audience — Germany or London should be relatively close to reality if your users are French. Logically you can even imagine a relatively lower loading time if your hosting provider’s data centres are located in France.
However, I advise against taking into account the performance score and Pingdom’s recommendations. Personally I find the tool is poorly calibrated in this regard, as it sometimes delivers false indications because it does not always detect optimisations that have already been carried out. Moreover, compared to WebPageTest you will not have much to go on. What interests us here is loading time only. In our case, for example, it is 1.2 seconds for the home page (the heaviest page on my site) — so we can imagine that speed optimisation is no longer necessary, it is largely correct and sufficient (at least on desktop).